
Assessing PFAS Data Quality for Compliance to USEPA Method 1633A
By Andrew Tomlins
PFAS analytical methodology uses Extracted Internal Standards (EIS) to assess how the method is performing against the sample. For this reason, it is important that EIS recovery data is reviewed for every sample.

What is an EIS? USEPA Method 1633A describes it as the following: Extracted Internal Standard (EIS) – An isotopically-labeled analog of a target analyte that is structurally identical to a native (unlabeled) analyte. The EIS compounds are added to the sample at the beginning of the sample preparation process and are used to quantify the native target analytes.
The EIS recoveries ideally would all be near 100% and determine that the PFAS methodology was fit for purpose for the samples analysed. In reality, there are matrix affects, pH changes, differing moisture content – all which can affect these recoveries and why USEPA Method 1633A has recovery limits typically in the range of 40-130%. However, some are as low as 5%, and some as high as 365%, depending on matrix. Table 6 and 8 of the USEPA 1633A method detail the acceptance criteria.
The EIS recoveries indicate how the submitted samples are performing against the method. The laboratory reported results for target analytes are recovery corrected using this EIS method of quantification. As an example, to determine an EIS for PFOS, a synthetic EIS PFOS compound is added prior to the sample undergoing the analytical process. If the EIS recovery at the end of the analytical process is 50% and the PFOS compound is 1 ug/kg, then the laboratory would adjust the result to 2 ug/kg to account for the 50% loss in the EIS.
Painstakingly reviewing EIS recoveries and ensuring there are no issues, while important, can take significant time if done manually. The EQuIS® Data Qualification Module (DQM) can make this task much easier. EIS recovery data can be assessed to a method such as USEPA Method 1633A as sample results are received.
Assessing EIS Data: An Example
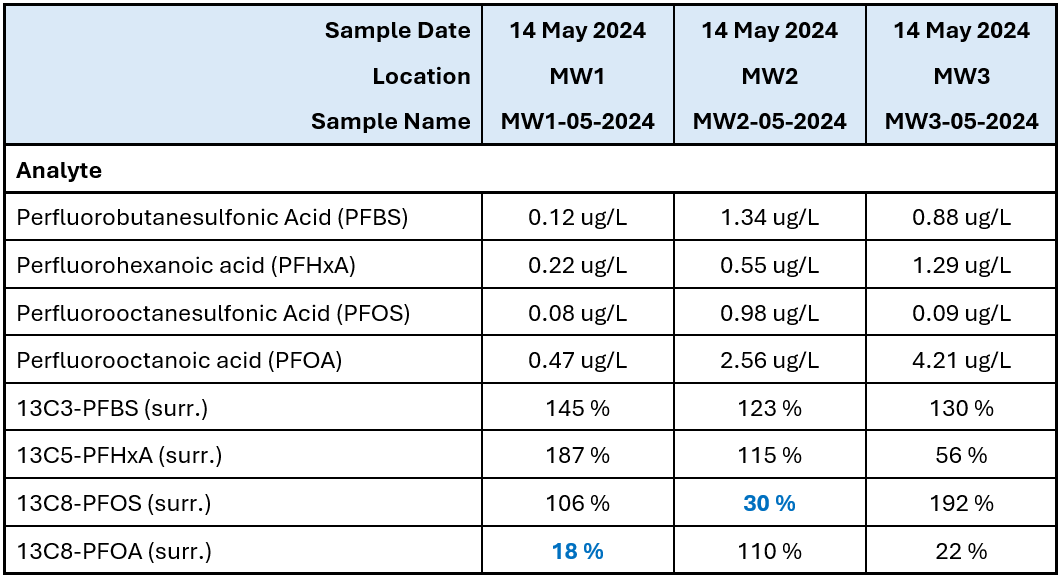
We quickly see there are some EIS recovery issues flagged with 18% for PFOA and 30% for PFOS. This could be difficult to see in a dataset of hundreds or thousands of samples. EQuIS DQM can quickly highlight the data issues.
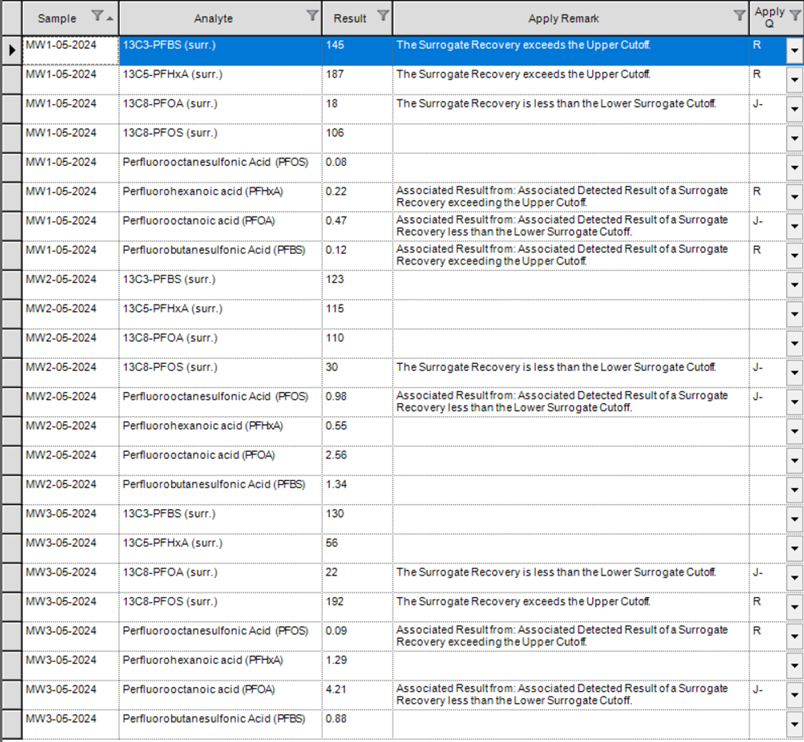
DQM shows this when looking at one sample, MW-2-05-2024:

We have a result of 0.98 for PFOS and a remark that the result is affected by a low surrogate cutoff; in other words, the recovery for the surrogate was below our set limit. This aligns with the flagged recovery of the PFOS EIS at 30%. We set DQM to insert a qualifier code of “J-” next to any such result.
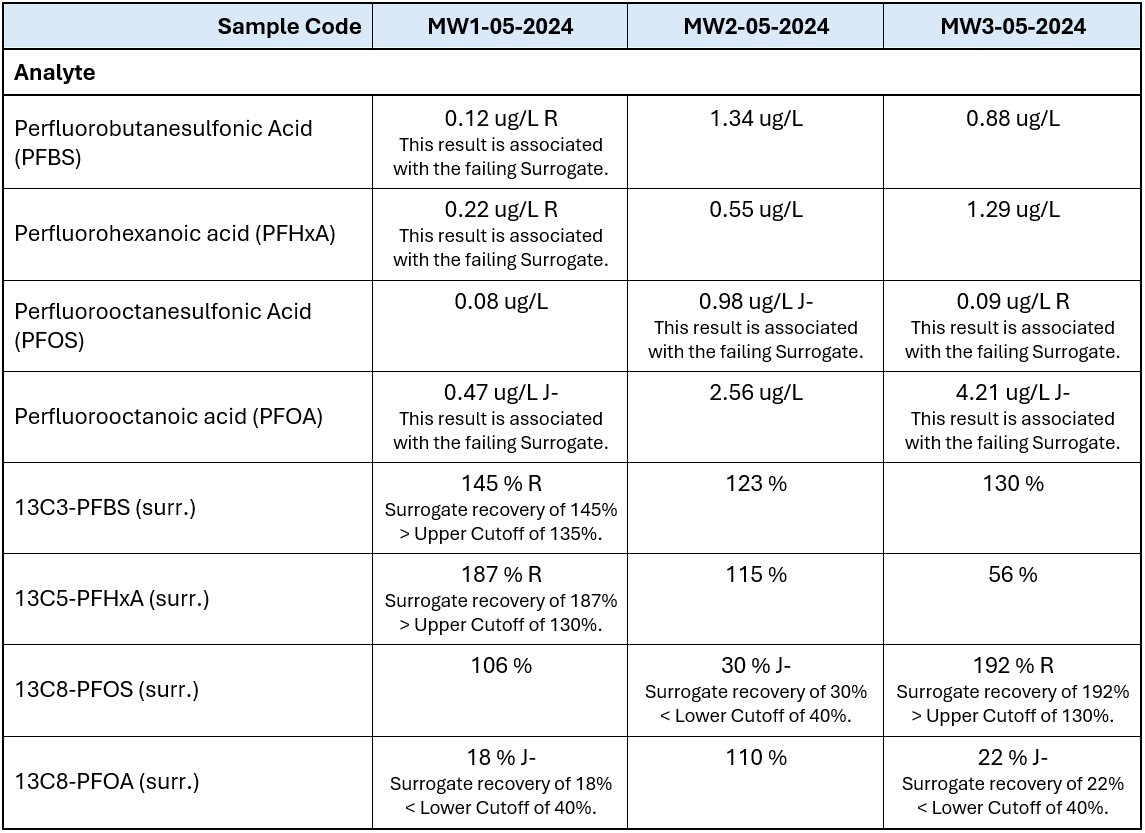
This summary has importantly not flagged any other results as the EIS recoveries are within acceptance criteria. This is expected as we only want to flag the results affected by the EIS failures and the PFOS EIS failure only affects the PFOS result. While this is fairly simple for one sample, see below how the three samples in our original dataset appear:
The picture becomes more complex with multiple recovery issues. This is only assessing EIS recoveries. There are many other quality checks in DQM, including field duplicates and laboratory control standards.
Table summaries can quickly outline the data quality issues and communicate clearly where the issues are and for what reason.
Conclusion