
By: Michelle M. Wagner, P.G. (Senior Geologist/Database Manager); Daniel J. Lombardi, P.G. (Senior Hydrogeologist/Groundwater Model Expert); Jim Depa (Principal Geologist/Data Visualization); and Dominick Gagliano (Staff Engineer/Data Analyst)
Executive Summary
Now more than ever, the data generated from environmental consulting projects needs to be effectively managed, quickly distilled, and visualized to facilitate timely and comprehensive understanding of site data. To accomplish this, the geologists and engineers at Swenson-Marzec & Associates, Inc. (SMA) have used the EQuIS Representation State Transfer Application Programming Interface (REST API) to acquire comprehensive data sets for a variety of purposes, including complex and multifaceted data evaluations. Specifically, SMA leverages the EarthSoft EQuIS REST API to securely access and operationalize verified environmental data managed within EQuIS. By integrating EQuIS REST API with Python-based tools, SMA developed Icarus, a custom data evaluation program. This approach highlights how EQuIS serves as a robust data foundation, enabling flexible downstream applications like Icarus to support advanced analysis and decision-making.
EQuIS As The Data Foundation
Effective data management and a reliable data foundation are the framework for success. EQuIS provides a centralized system of record as a data foundation, standardizing complex data into a structured, scalable model, enabling efficient querying and long-term usability as datasets grow. Built-in verification and quality controls engaged through the EQuIS Data Processor (EDP), support the ingestion of high-integrity data into the central system of record and accuracy of data outputs. This ensures consistency, traceability, and dependability, which are necessary for managing decades of multifaceted data.
While EQuIS remains the system of record, the EQuIS REST API extends this foundation by enabling secure, real-time access to governed data. Icarus builds on this foundation as a tailored user interface for SMA to serve client needs, delivering curated views and streamlined workflows. This expands EQuIS-native capabilities, such as Mann-Kendall trend analysis, enabling more complex analysis of multifaceted large data sets in an expeditious manner.
Introduction
For nearly 50 years, a wide variety of data has been collected at a confidential large-scale petroleum remediation project in southern Illinois, including fluid elevations, geologic descriptions of the subsurface soils, and laboratory analytical data. In total, more than 18 million records have been generated to date and ongoing monitoring means that additional data will continue to be generated. This data is crucial in understanding the effectiveness of the active and passive remediation systems and helps SMA and our client understand how natural processes are enhancing the remediation of the site. However, this requires continuous data management, updates, interpretation, and presentation of the subsurface data in a way that provides clear and useful information. This white paper presents three types of data analysis used in Icarus and how it is presented in a meaningful way. All data used in this effort is managed within the EQuIS platform, ensuring consistency, traceability, and accessibility across decades of site operations.
The First Step – Access Point
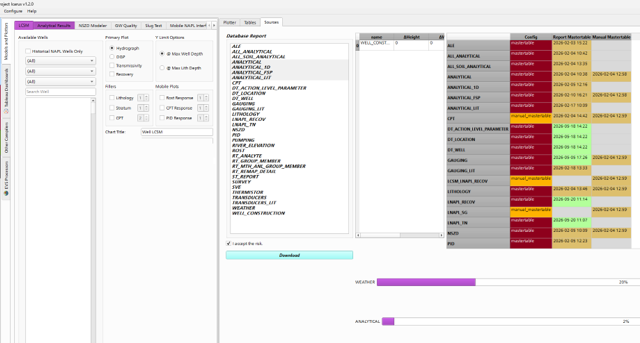
The image below shows the backbone of the Icarus program – the interface between the EQuIS REST API and Icarus. From here, the data managed within the EQuIS platform can be securely accessed through the REST API and imported into Icarus, either automatically or by user request. The EQuIS REST API provides a standardized interface for accessing governed environmental data, ensuring that downstream applications like Icarus rely on consistent, validated information. This ensures that the most accurate and up-to-date data is being utilized by Icarus to create graphs, charts, and other visualizations, or to perform statistical analysis such as the Mann-Kendall and Shapiro-Wilks tests. Everything in the EQuIS database can be extracted, from lithologic data to up-to-date laboratory analytical data and fluid gauging measurements, using existing EQuIS report queries or custom-made reports / SQL queries.
The Why? – Insights
-
Analysis of Laboratory Analytical Data Trends
Leveraging EQuIS as the system of record ensures that all analytical data used in visualization workflows is verified, complete, and consistently structured. The subject site contains over 400 groundwater monitoring wells, many of which have been sampled for more than 50 constituents on a regular basis. This has resulted in an immense amount of laboratory analytical data over the years. Using the EQuIS REST API, analytical data can be exported to Icarus and plotted graphically, where trends can be observed and explored.
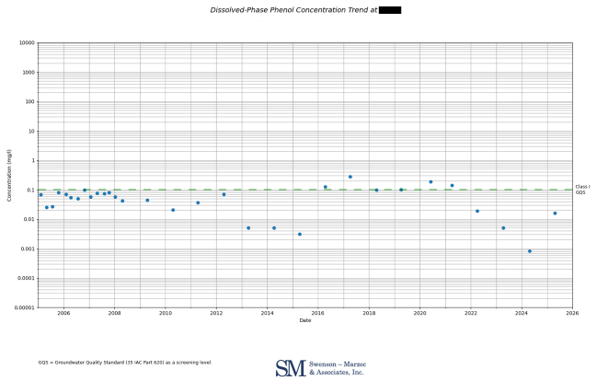
For example, the graph below depicts the phenol concentration in groundwater at a particular monitoring well over time, with the Class I Groundwater Quality Standard (GQS) shown as the dashed green line. The graph clearly depicts the concentration over time and shows when the action level is exceeded.
The EQuIS REST API enables seamless delivery of verified data to Icarus and allows for creation of graphs like these, expeditiously trending any analyzed constituents in groundwater at any well. These trend graphs and visualizations are extremely useful and can be applied to other media. For example, a fence-line monitoring program for air monitoring that could automatically send an alert as a phone notification if a particular action level is exceeded in real time.
-
Mann Kendall Analyses
As mentioned above, large batches of analytical data are being generated with every sampling event, however, certain analytes or constituents of concern (COC) in some of the monitoring wells are no longer generating meaningful data or are no longer of concern. Generally, to cease the sampling of a monitoring well and/or removal of a COC(s), most oversight programs require that a stable or decreasing concentration trend is present and/or a GQS has been achieved. This typically involves performing a Mann-Kendall statistical analysis on the analytical results to evaluate and confirm a trend. This was once a cumbersome process that could take several hours to complete. The EQuIS REST API streamlines access to large analytical datasets, enabling tools like Icarus to perform statistical analyses such as Mann-Kendall trend testing efficiently across multiple wells and analytes.
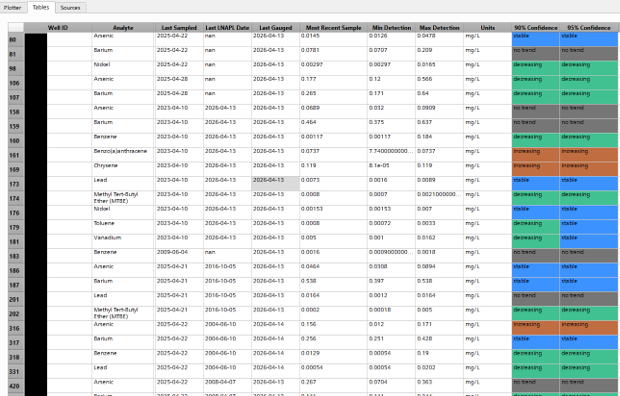
The Icarus program also has several adjustable parameters (including confidence level) to ensure regulatory compliance with different state and federal requirements. The image below shows a subset of the Mann-Kendall results generated using the EQuIS REST API and Icarus.
-
Creation of Well-Specific Conceptual Site Models
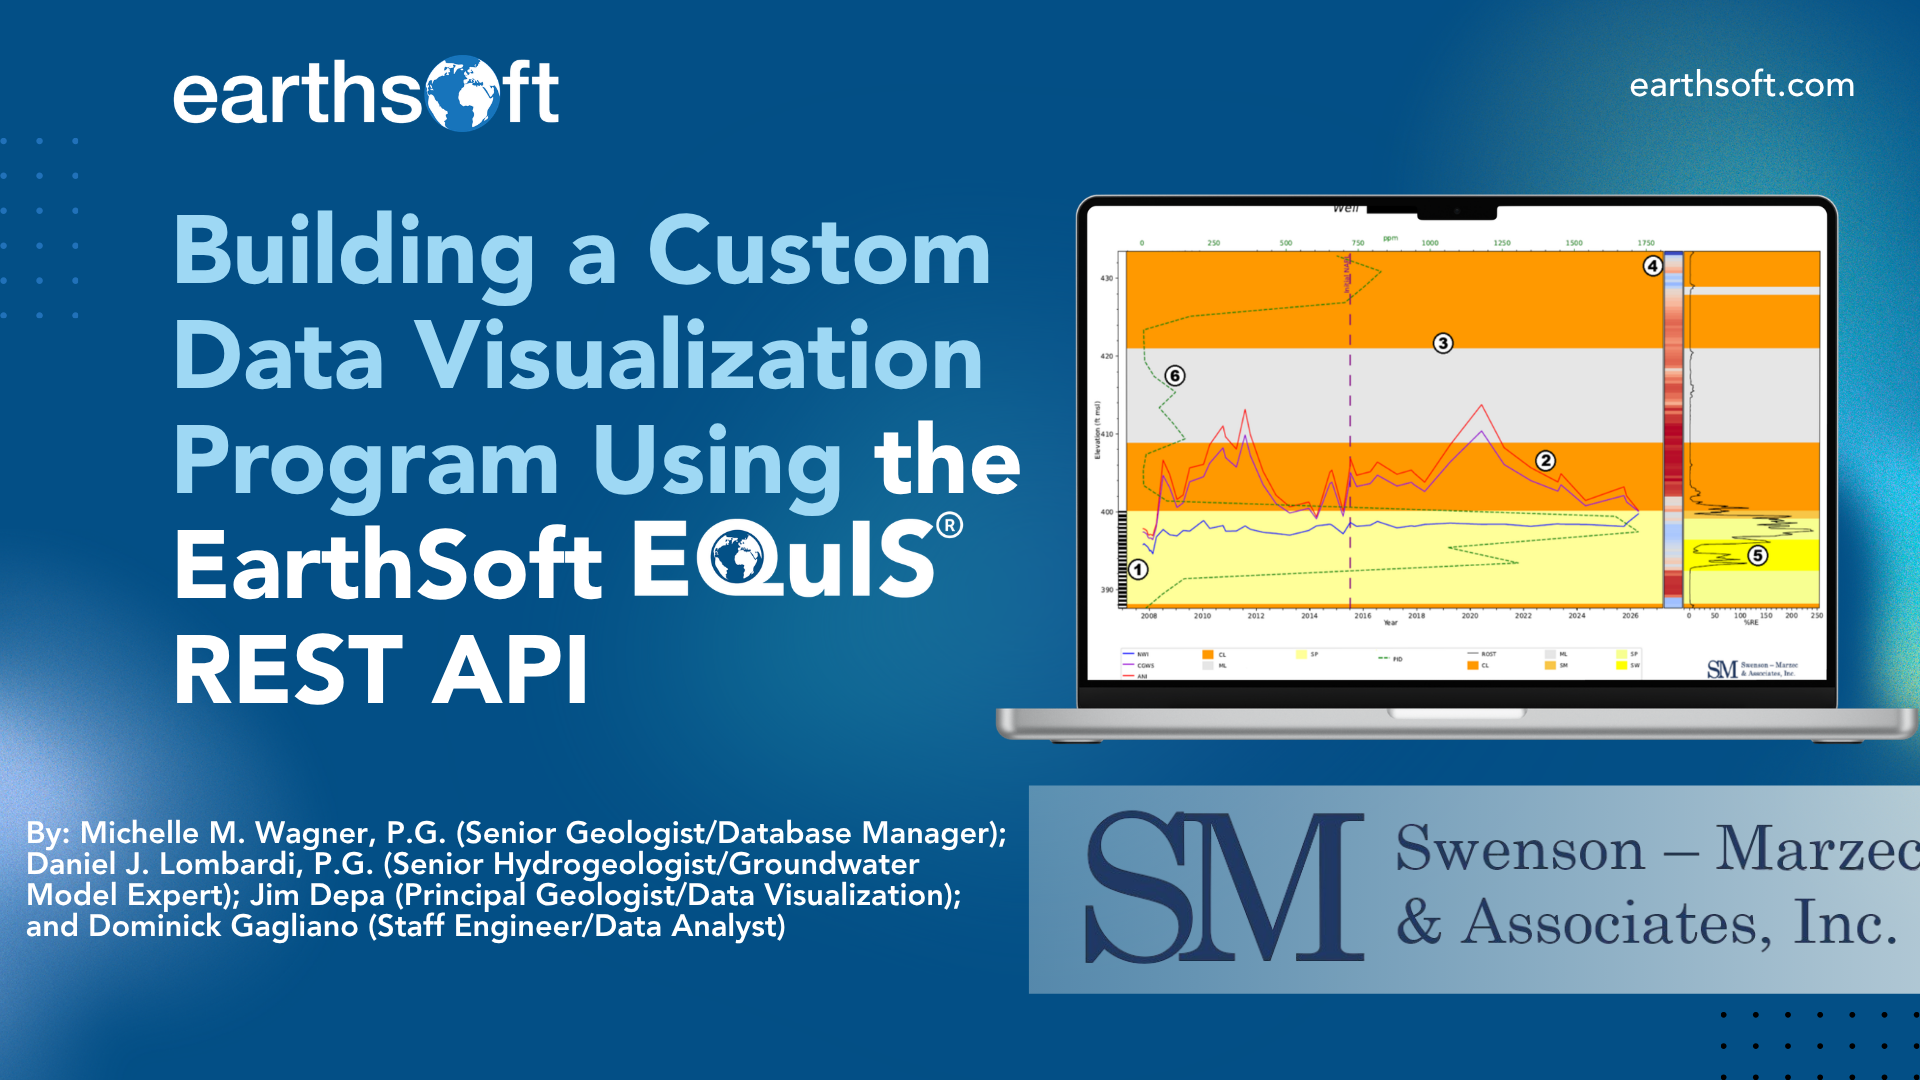
To understand the hydrogeologic processes occurring in the subsurface, various pieces of data need to be viewed simultaneously including water level depths, depths to light non-aqueous phase liquid (LNAPL), well screen depths, lithology, etc. Using the EQuIS REST API, the most-up-to-date groundwater and LNAPL elevation data can be uploaded to Icarus to quickly create (and update) well-specific Conceptual Site Models (CSMs) and LNAPL CSMs (LCSMs). These models are crucial for understanding the behavior of groundwater and occurrence of LNAPL in the subsurface, and can help optimize remediation systems or even predict future vertical extents of the LNAPL. One such model is shown below, and the specific graphical components depicted are as follows:
| 1 | Monitoring Well Screen Location |
| 2 | Fluid Elevations (Water, Corrected Water, and LNAPL Surfaces) |
| 3 | Lithologic Data from Boring Logs |
| 4 | Cone Penetrometer Test (CPT) Data (Soil Behavior) |
| 5 | Laser-Induced Fluorescence (LIF) Data (Historical LNAPL) |
| 6 | Photoionization Detector (PID) Data |
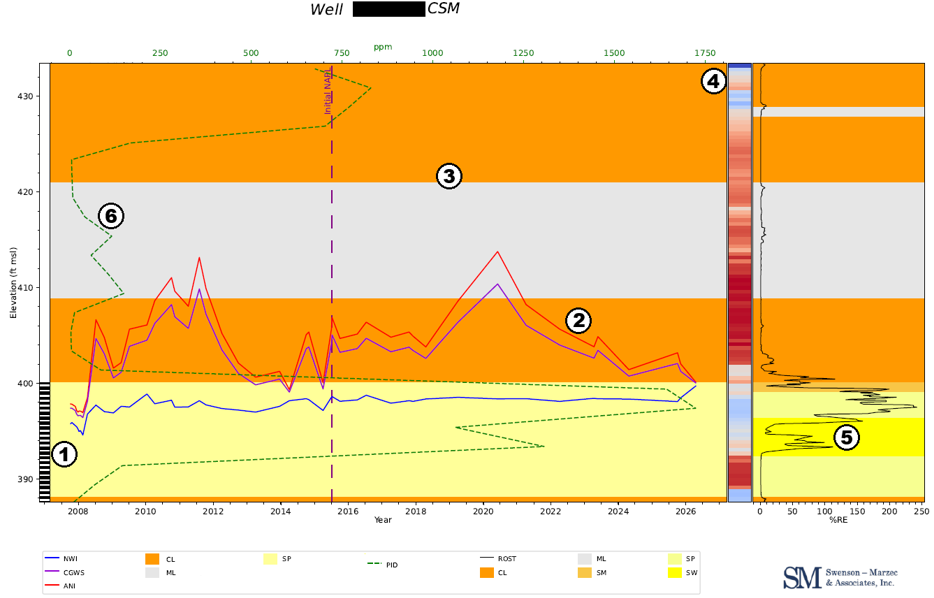
Together, these graphical components can provide interpretations regarding the impacted lithologic layers, whether the LNAPL is confined or unconfined, the actual thickness of the LNAPL in the formation, how the LNAPL thicknesses in the well and formation react to changes in fluid elevations, and how measured soil behavior matches the lithologic data in the boring logs. Because these models are powered by data sourced directly from EQuIS, users can be confident that visualizations reflect the most current field and laboratory data. Using the EQuIS REST API and the Icarus program, LSCMs can be completed on the spot with any number of graphical components for hundreds of wells.
The Future – Functionality and Transparency
By leveraging data accessed through the EQuIS REST API, Icarus enables broader access to high-quality environmental data to team members, the client, or other stakeholders while maintaining the integrity and governance provided by EQuIS. This allows anyone to use the program to produce their own visuals, rather than having the data analysis and visualization process performed by a small silo of individuals. This empowers everyone on the project team to become more involved with the understanding of the CSM, be involved in the decision-making process, and provides a great deal of transparency to all parties involved.
If you are interested in learning more, please contact MichelleW@smaenv.com.
To learn more about EarthSoft and EQuIS please contact info@earthsoft.com.
Own the Workflow, Make Better Decisions
To learn more about EQuIS digital workflow solutions, contact one of our representatives today. Please write info@earthsoft.com for further information.